Turning Data into Impact: Designing VTMHI’s Annual Impact Report

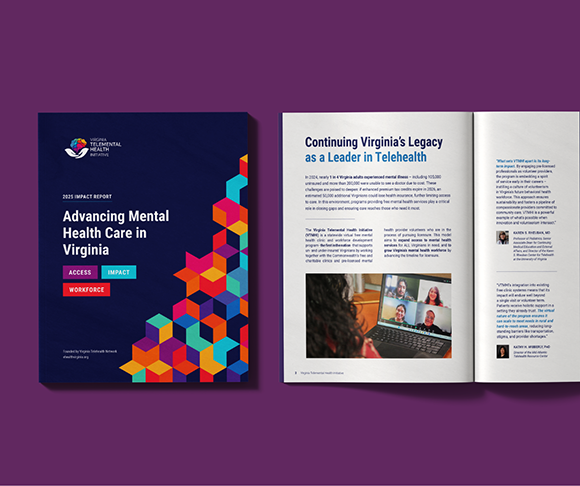
When the Virginia Telemental Health Initiative (VTMHI) began putting together its annual impact report, it was working with something complex: a story told through both numbers and people.
VTMHI connects patients with providers through telehealth services to expand mental health care services across Virginia. The report needed to clearly show the impact the organization has made while keeping the people behind the work at the center.
And that’s where we come in.
Pulling the Pieces Together
Many impact reports have the challenge of balancing statistics with storytelling, structure and warmth. VTMHI’s content included a range of elements, from detailed metrics and patient outcomes to volunteer highlights and future goals. Without thoughtful design, all that information easily could become lost in the shuffle.
Our Creative Services team approached this project with a question: How would someone actually experience this report?
From there, we focused on the following:
- Clarity and Navigation: The report had to guide readers through complex information in a way that felt easy to follow.
- Human-Centered Data: Patient total visits, volunteer highlights and clinic partnerships needed to be presented alongside important context and visuals so readers could understand what the numbers actually represented from their perspective.
- Visual Flow: Each section had to flow naturally.
- Compassionate Tone: The design needed to reflect VTMHI’s mission by balancing credibility with warmth.
Designing with Readability, Hierarchy and Flow
In designing the report, we focused on building a layout that placed clarity top of mind. Typographic hierarchy is an important element that helps guide readers, and intentional spacing and content grouping made things easier to digest.
Longer narrative sections, such as patient stories and volunteer testimonials, were broken up with callout boxes and visual breaks. Key statistics were set apart, making them easy to spot without overpowering the page. Headlines and subheads provided structure, allowing readers to skim when needed or dive deeper if they wanted more context.
This meant a lot of back and forth behind the scenes. As feedback came in, design layouts were refined and adjusted to make sure the report felt cohesive and approachable.
Designing Data with People in Mind
When working with a lot of data like charts, maps and percentages, it’s easy for things to start feeling bogged down. While important, these insights don’t tell the full story on their own.
For VTMHI, the numbers represent real people gaining access to care, volunteer providers working toward licensure and clinic partners expanding mental health services across the state. The report needed to make these connections real.
Photography helped ground those numbers in real experiences. Visual mapping showed how care and volunteer support are reaching various communities throughout Virginia. Spreads dedicated to recognizing the volunteer providers and clinical supervisors helped put faces to the work. Together, these elements kept the report focused on people, not just the numbers.
Collaboration at Every Stage
Like many creative projects, collaboration played a big role in shaping the final report. Our Creative Services team worked closely with the broader account team to make sure the messaging and visuals complemented each other. Client feedback also ensured clarity and tone, while getting buy in along the way.
Some of the most valuable conversations with the team were about emphasis. How do you highlight a quote without overpowering the page? How does one transition spread into the next? Even small decisions such as choosing bold number callouts rather than decorative icons were part of conversations in figuring out the best way to present the different kinds of data in the report.
Supporting the Work
At its core, the project was about creating a report that people could actually use. It needs to assist in conversations with partners, clearly present outcomes and accurately represent the breadth of VTMHI’s work.
The final designed report brings together patient data, volunteer milestones and clinic partnerships in a way that feels organized and easy to follow.
For our team, this piece was a meaningful opportunity to support expanded access to mental health care across Virginia and to help make that work more visible.
We’re grateful to have worked alongside VTMHI and proud to have played a role in bringing its impact to life. To see the full report, tap here.
Amber Ekizoglu
Amber Ekizoglu loves bringing ideas to life in visuals that tell a story. She joins our Creative Services team as a junior graphic designer, supporting client work across the agency.
Leave a Reply